Health and wellness · Studio
A web dashboard for parents and psychologists to analyze the data collected while children play on their phones
Project summary
- Industry
- Health and wellness
- Company size
- Studio
- Services
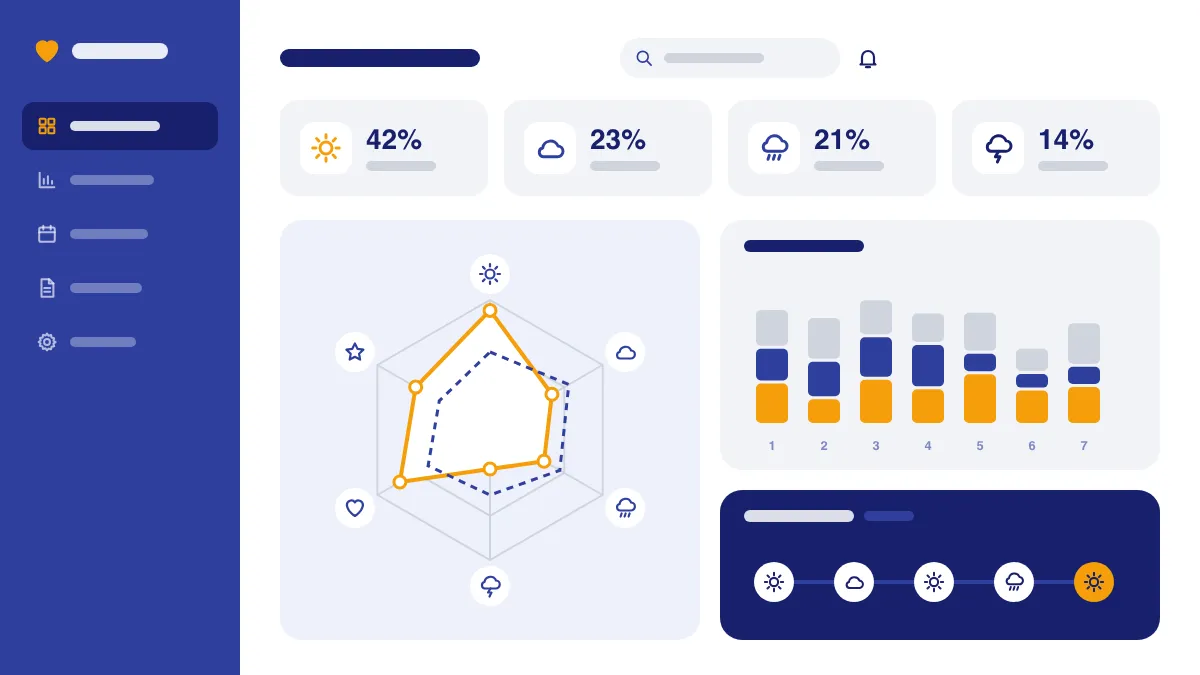
The problem
A mobile game collects data while children interact with it. Parents and psychologists needed a place on the web to access and analyze that data. The project also needed an institutional page.
What was agreed
- Prioritized scope
- A web dashboard, where parents and psychologists access and analyze the data collected while children interact with the mobile game, plus an institutional page, both part of the game project's ecosystem.
What was delivered
Parents and psychologists follow the game's data on the web, and the project has its own institutional page.
Who it’s for
The dashboard is for parents and psychologists. The game the data comes from is an educational mobile game about emotions.
How it works
While children play, data from that interaction is collected; the web dashboard, opened in a browser, is where parents and psychologists find it. The dashboard and the institutional page sit in the same ecosystem as the game.
The technology, in plain words
- JavaScript: the programming language of the web, which gives pages behavior in the browser and also runs on servers. It is the language of the dashboard and the page.
- React: a JavaScript library for building interfaces from reusable components. The dashboard and the page were built with it.
- Firebase: a set of Google services that gives apps a ready-made server side, such as user accounts and databases. It was also part of building the dashboard and the page.
How it went
Assessment
At the start
An initial conversation to understand the client's request and problem.
Discovery Sprint
Before building
The problem was understood and the scope defined.
Development
Between 2017 and 2019
Built in incremental releases throughout the project, not all at the end.
Support and continuous improvement
After going live
The dashboard and the institutional page then moved into support and maintenance.
Technical details
Technologies used in this project
- JavaScript
- React
- Firebase
More case studies
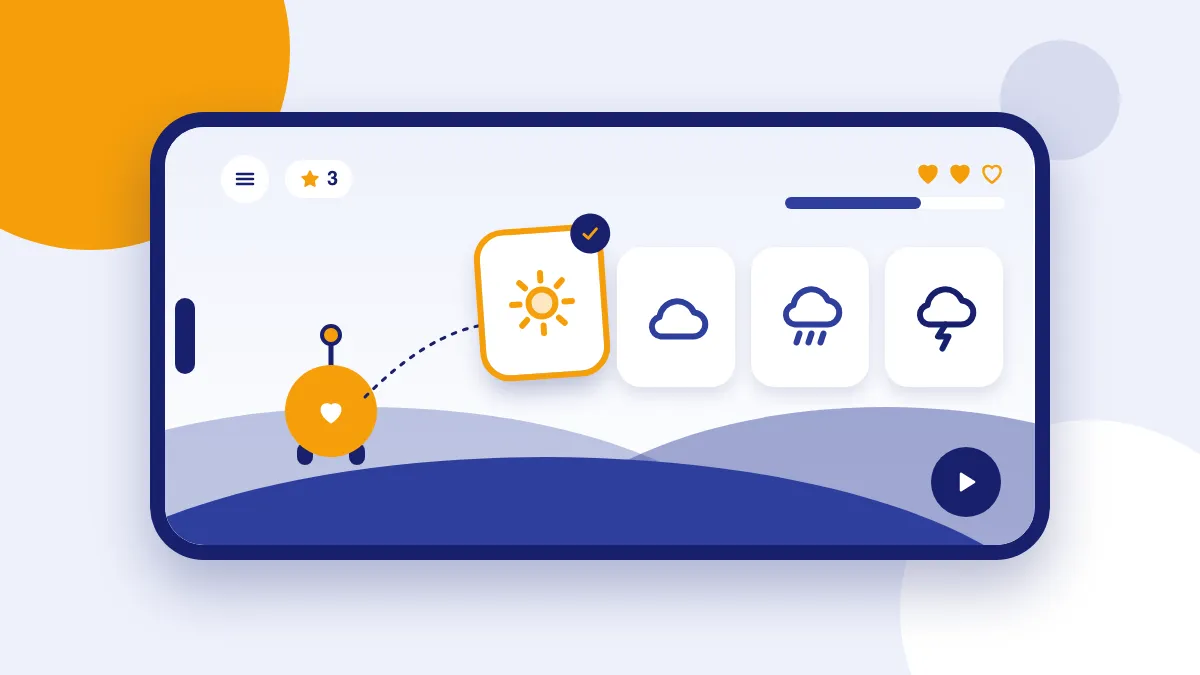
A mobile game designed to help children identify and understand their own emotions
The problemThe goal was an educational mobile game to help children identify and understand their own emotions. Beyond the gameplay, the project had to manage users and record the actions and choices each one makes inside the game.Services:Mobile appsRead the case study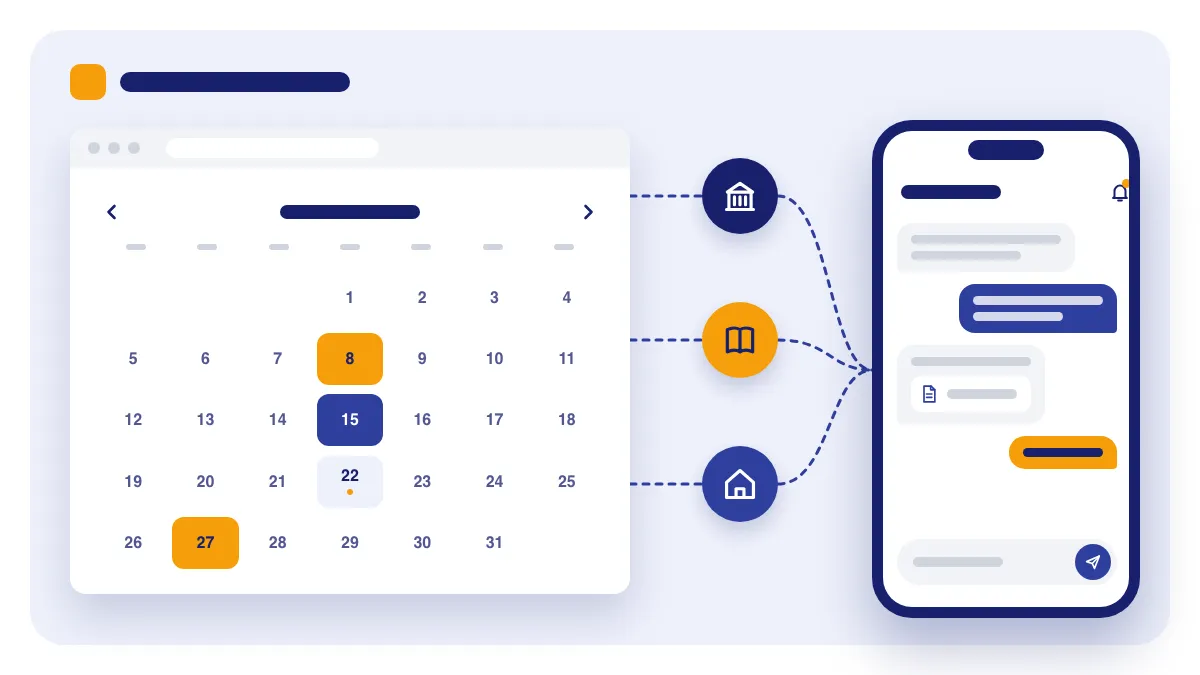
A school management system that brings school administration, teachers and parents closer together
The problemThe goal was to bring together and connect three school audiences: the administration, the teachers and the students' parents. That called for a school management system that brought all three together, with access on the web and on phones.Services:Web applicationsMobile appsRead the case study