Manufacturing · Multinational
An information dashboard that shows air quality indices in real time
Project summary
- Industry
- Manufacturing
- Company size
- Multinational
- Services
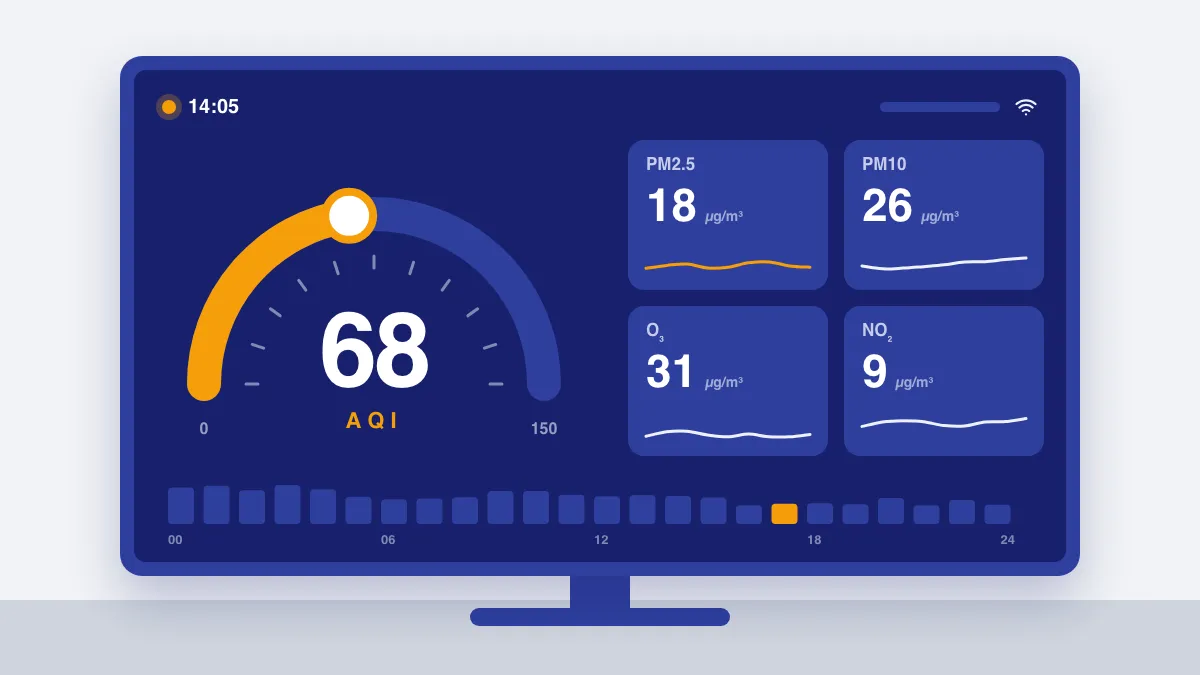
The problem
A multinational manufacturing company wanted an information dashboard that showed air quality indices in real time. For the numbers on screen to keep up with the measurements, the dashboard had to pull data directly from an air monitoring API, the service that provides those measurements.
What was agreed
- Prioritized scope
- Development of the information dashboard's front-end interface, the part that appears on screen, and a direct integration of that interface with an air monitoring API.
What was delivered
Anyone who checks the dashboard sees air quality indices in real time.
Who it’s for
The dashboard was created for a multinational manufacturing company and is for people who want to know how the air quality is.
How it works
An API is the doorway through which one system hands data to another; here, the monitoring API provides the measurements. Because the interface connects directly to it, what appears on screen keeps up with that data.
The technology, in plain words
- HTML: the language that organizes the content of a web page, such as text, images and buttons. It was used in the dashboard interface.
- SCSS: a way of writing CSS, the language that defines how pages look, with extra features such as variables; it is turned into plain CSS before it reaches the browser. It was used in the dashboard interface.
- JavaScript: the programming language of the web, which gives pages behavior in the browser and also runs on servers. Of the project’s three technologies, it is the one that connects the dashboard to the air monitoring API.
How it went
Assessment
At the start
An initial conversation to understand the client's request and problem.
Discovery Sprint
Before building
The problem was understood and the scope defined.
Development
Between 2019 and 2021
Built in incremental releases throughout the project, not all at the end.
Support and continuous improvement
After going live
The dashboard then moved into support and maintenance.
Technical details
Technologies used in this project
- HTML
- SCSS
- JavaScript
More case studies
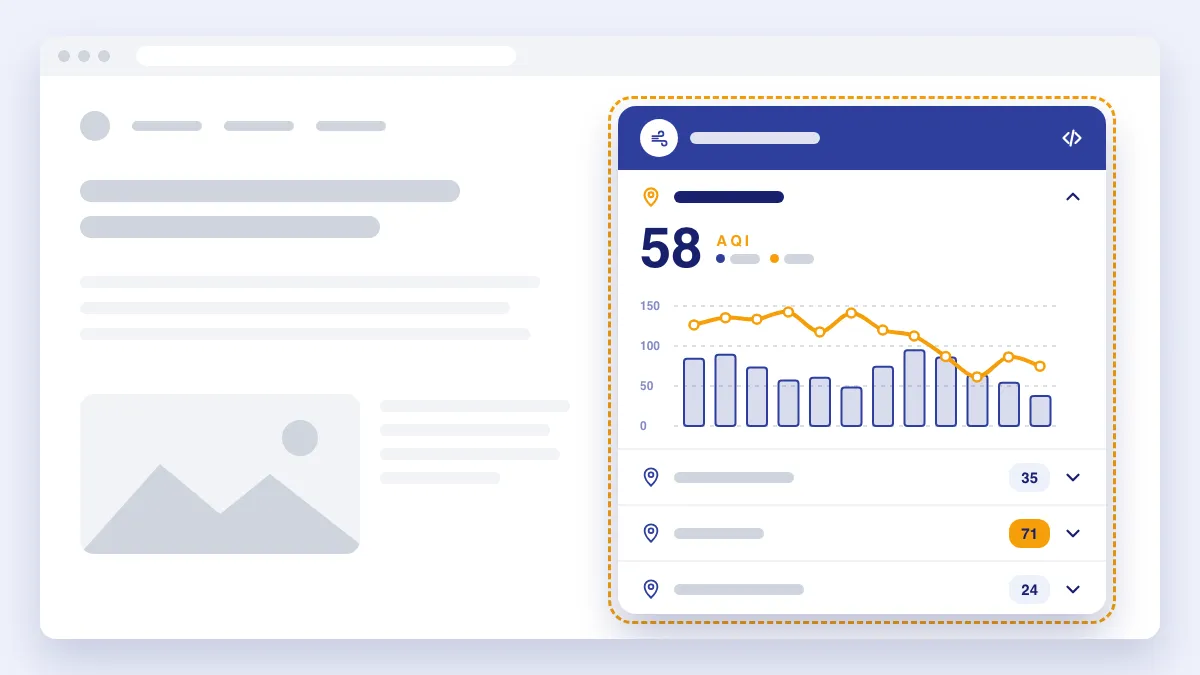
A widget for external websites that shows the air quality of a selected city in charts
The problemA multinational retailer needed a component that could be embedded in external websites to show the air quality of a selected city. The information had to appear in dynamic charts connected to an environmental data API, the service that provides this data.Services:Web applicationsIntegrations and automationRead the case study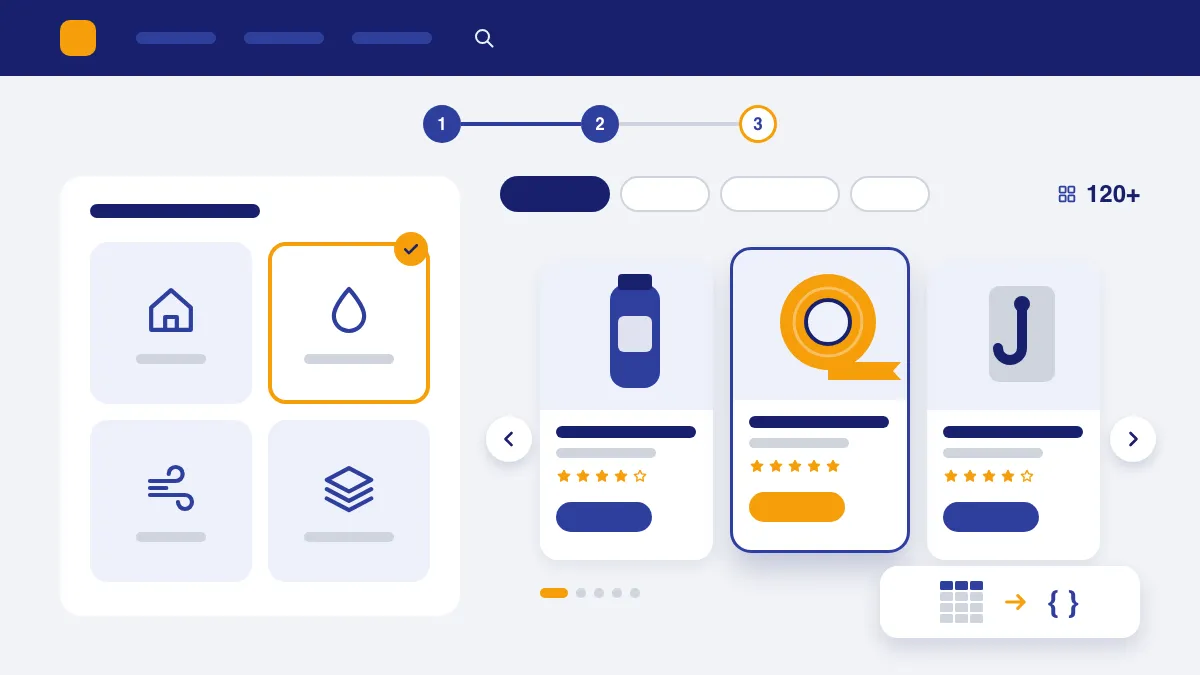
Product and space selectors that help users find the right option among more than a hundred
The problemWith more than a hundred options available, users needed help finding the one that fit their case. A partnership between two multinationals, one of them in retail, called for pages that guide this choice, with product and space selectors, across several projects.Services:Web applicationsRead the case study